Disclaimer: The opinions expressed here are for general informational purposes only and are not intended to provide specific advice or recommendations for any specific security or investment product. You should never invest money that you cannot afford to lose. Before trading using complex financial products, please ensure to understand the risks involved. Past performance is no guarantee of future results.
This article marks the beginning of a new series on our blog. We’ll dig into a trading strategy developed by QuickFingers Luc and apply it on Tuned. The core of the strategy is trading bounces and cracks. In this article we will explain what bounces and cracks are, how to spot this behavior around resistances and trade on them successfully. As a teaser: we’re going to follow up with a second article that will go over a script example, possible optimizations, and show results. But let’s first dive into the strategy itself!
Table of contents:
- Who is QuickFingers Luc?
- The strategy: Base Cracker
i. What are ‘Bases’?
ii. What are ‘Bounces’?
iii. What are ‘Cracks’? - Exiting trades
- Turning the strategy into a script
- Conclusion
Who is QuickFingers Luc?
Luc has been a professional trader for almost 15 years and built a following through Steemit and Youtube. What sets him apart from other traders in the community is his consistently high win rate. A big contributor to this success is a combination of risk management and strict rules, which Luc highlights the importance of:
- Trading is difficult
- It requires discipline
- It requires patience
- The aim is consistent returns for long term longevity
- There are no shortcuts
The strategy: Base Cracker
Luc teaches how to read charts and price action to distinguish noise from significant price movements. He highlights the emotional part of markets and how to filter them. This is done by being on the other side of panic selling. In other words, the strategy is focused on buying emotional dips. By nature of his strategy, signals appear at a slow cadence, so some patience is necessary. Alternatively, you can trade across multiple pairs to increase the cadence. Below we will cover the technical components of the strategy and explain how to find the points in time Luc denotes as ‘emotional dips’.
The strategy is composed of 3 major concepts: ‘Bases’, ‘Bounces’ and ‘Cracks’. We will cover Bases first, followed by Bounces and lastly we will talk about Cracks.
What are ‘Bases’?
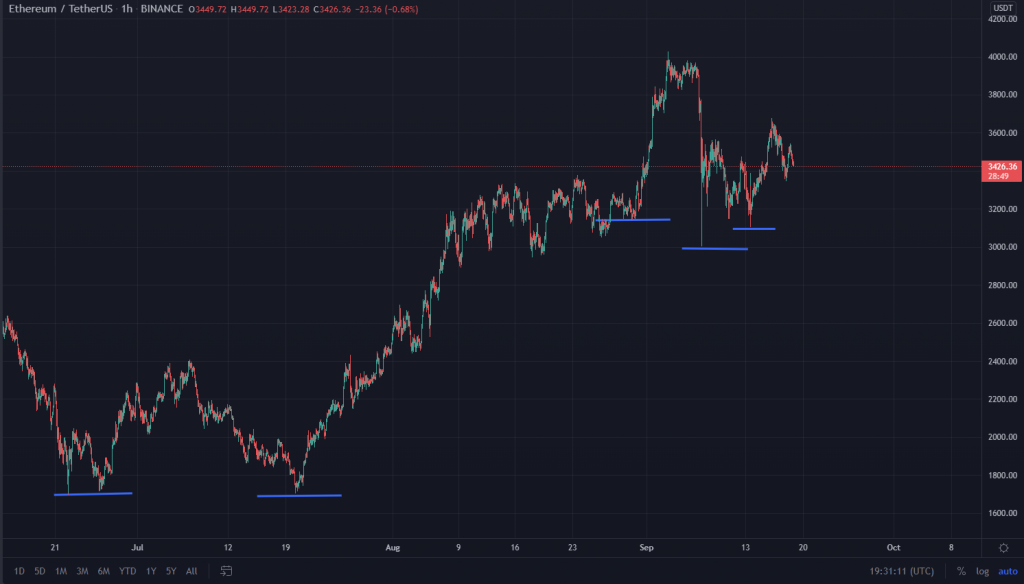
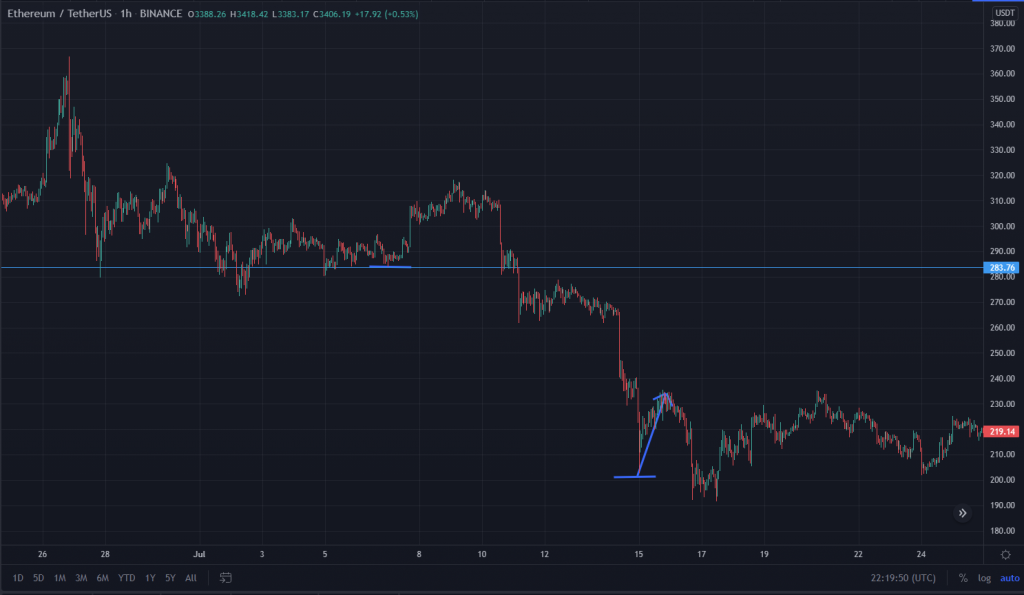
Luc defines Bases as a price level where there’s high demand, usually, this means a support level. So the stronger the buyer’s reaction, the better. Each base must be clear and obvious. Below are some examples, highlighted by blue lines.
What are ‘Bounces’?
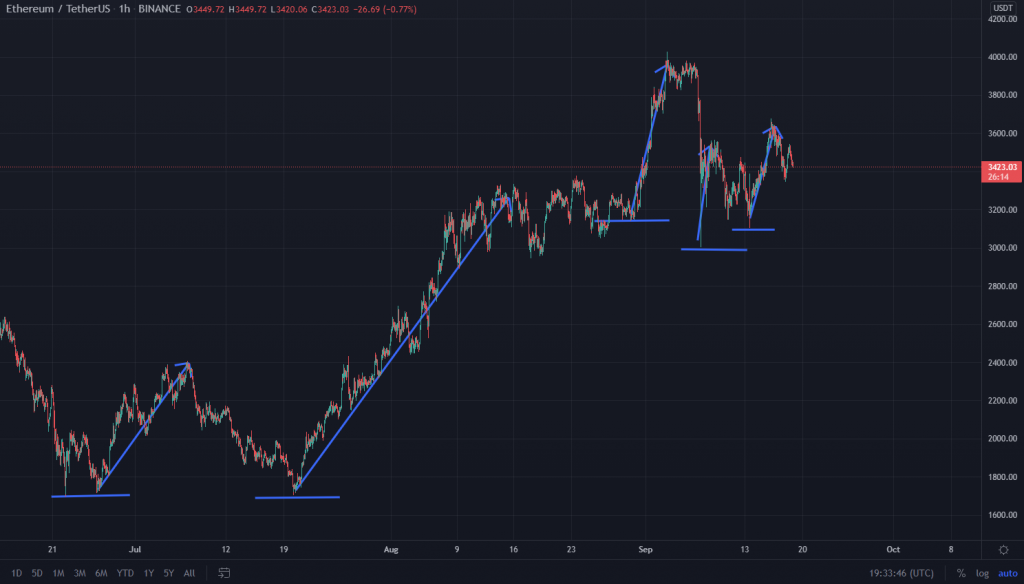
The second concept Luc introduces is Bounces. Bounces are strong price movements that follow a base. These movements are noted below, shown with blue arrows.
What are ‘Cracks’?
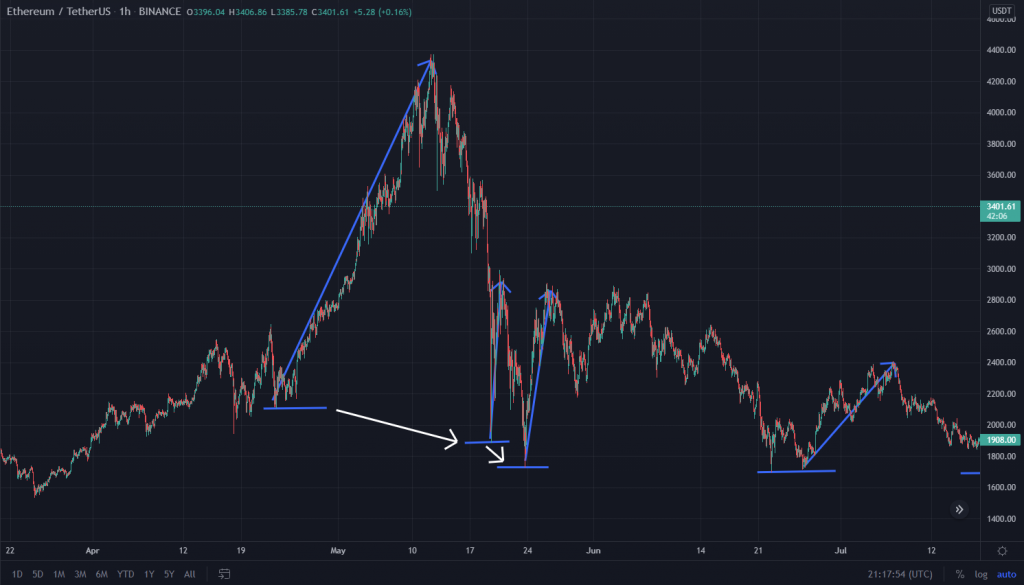
The last concept of the strategy is the Crack. This is when a Bounce reverses direction and breaks through the latest Base. This forms what Luc calls the safe zone to buy, until the next base is formed and price reverses. We highlighted some examples with white arrows below.
Remember that the safe zone to buy only exists below the latest base.
Here’s another example.
Exiting trades
Before digging into how to automate the use of Bases, Bounces and Cracks to open a trade, we should understand how to exit these trades. After cracking (breaking) the base, meaning an emotional price drop, we expect price to return upwards to the same level as before. There are multiple options for traders knowing this. You can go for a more secure trade, aiming for 2-3% profit. Or you could try to catch a full bounce, in crypto often leading to 10-20% profit if you can time your exit. Giving us these options, the strategy is highly adaptive.
Because of the strict rules in Luc’s strategy, both the buy rules and sell rules can be written as a script. Meaning that Tuned backtests and batch tests may reveal optimal entry and exit points for the market of your choice. On top of this; as we’ll see in the next chapters, this automated strategy has a high win rate, similar to Luc’s manual trading.
Turning the strategy into a script
Having understood this strategy’s foundation, let’s look into automating trades. We’ll start by listing the steps necessary to write the script:
- Calculate, plot, and verify the strength of bases.
- Calculate the average % dip of cracks that occurred in the past.
- Use Luc’s position sizing technique: start small and increase your position as price dips. We’ll find optimal results by batch testing, but here’s a starting point:
| Layers | % Of Total Account |
| 1 | 3% |
| 2 | 4% |
| 3 | 6% |
| 4 | 8% |
| 5 | 10% |
| 6 | 15% |
| 7 | 22% |
| 8 | 33% |
Luc’s approach to this technique is to start nibbling after a base is cracked.
By defining several layers, we start with small positions, and increase accordingly as a crack deepens, before price reverses up. So, the longer the dip, the larger the total position will be.
This approach works in both bull markets and bear markets because it reacts to panic. As explained in the introduction, we’re hacking the emotional side of the market.
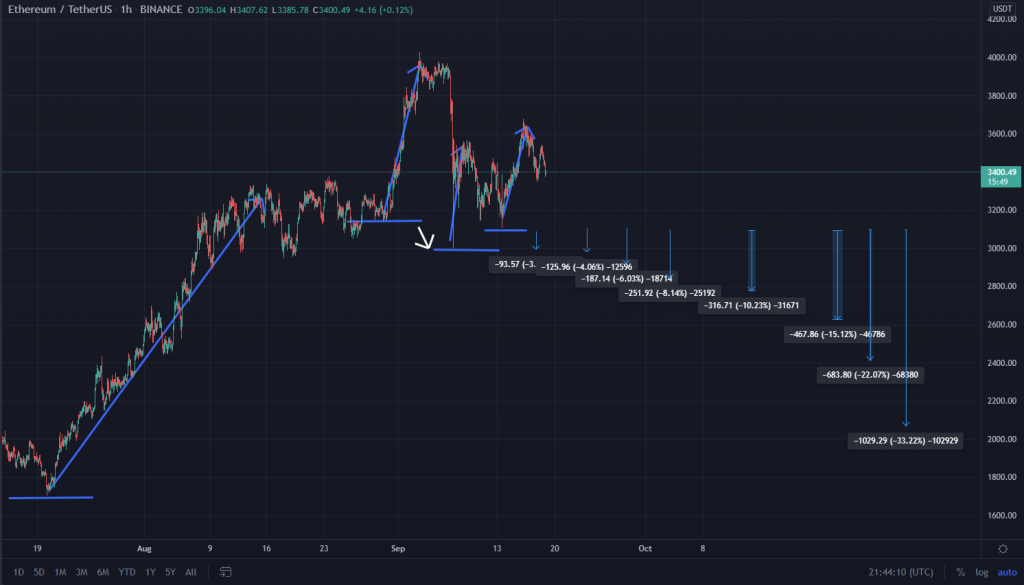
The graph above has our following layers plotted. If the last base is cracked, this is how we’d set up our subsequent buying opportunities.
There is another important rule: only the latest base is valid. If the last base wasn’t cracked and a higher one formed, the strategy defines unfilled orders must be cancelled.
If price action around a base has a weak bounce , meaning low volume and little price movement, there may not be many buyers for that level in the future. So if the base gets cracked, it’d be wise to either use less funds when layering positions, or to skip the trade. This is a part of the strategy that’s hard to get right: What is a good bounce? Testing this using a batch test can help you get a better
There is one catch with this strategy; when you are trading against the market you are trying to catch a falling knife. The last thing you’d typically want is to get stuck in a position.
Layering orders, with increasing funds on the way down, is one way to solve this problem, but we can do more. By looking into past data, we can calculate the average crack size and use it to determine our position sizes and entry levels, an excellent application of Tuned Batch Testing. We need to keep in mind that if a base doesn’t have a strong bounce, the next crack will most likely be larger than average.
If a bounce from a crack doesn’t reach the last base, it means demand has weakened. A stop-loss may be appropriate for situations like this, to help mitigate heavy losses. Another option is to sell on a small pump while price fluctuates downward.
You’ll want to enter a position when the next base is cracked.
In the graph above we give an example of an invalid base. The second base that forms (on the right side) isn’t valid because its bounce didn’t reach near the previous base (on the left side).
Adding to the above, the base is cracked but the volume is so low we don’t recover to the original price.
Conclusion
I hope you’ve grown in understanding about resistances and how you can use them to find buying opportunities. In the next part of this series, we’ll create a code example and show how to use Tuned’s batch testing system to find optimal parameters. This way you can automate these buying opportunities and if you want, trade with live funds!
Stay Tuned!
What Is Tuned Script and How Is It Different From Pine Script?
Table of contents: An alternative to Pine ScriptData FlowWhy two different languages?Example of Pine Script…
Creating Better Trading Strategies — The Future
And here we have it: the last installment of the data science article series! In…
Creating Better Trading Strategies — The Process
In our last blog post, I introduced my project to combine buy signals from different…
The Pitfalls of Backtesting – How to Avoid Overfitting and Disappointment
Table of Contents: What is overfitting?How do I avoid overfitting? For the investors reading this…


